Your first workspace
Move from your NukBord account to a selected trading account and a workspace you understand. Start with practice and inspect the connection before preparing anything.
3 chapters · 9 steps Open guideA clear way into the workstation
Start with an account, build your workspace, prepare deliberately and keep the record. Follow practical instructions for the controls in front of you.
The guides below are the product manual. An optional published introduction can add context; it does not replace the search, instructions or account help.
01 / Find your next task
Each guide includes preparation, ordered steps, checks and the limits that matter.
Move from your NukBord account to a selected trading account and a workspace you understand. Start with practice and inspect the connection before preparing anything.
3 chapters · 9 steps Open guideGive each chart a clear job, then save the arrangement you want to return to. Layout, instrument and drawing choices stay distinct from orders.
3 chapters · 10 steps Reading nowAnnotate the chart in front of you using that pane’s drawing column. Keep research drawings separate from the Entry Pad’s order levels.
2 chapters · 6 steps Open guideUse Tickers to organise what you follow, with a named list on the left, the instrument library in the centre and the selected instrument’s details on the right.
2 chapters · 6 steps Open guidePrepare a chart-based order as a draft. Review its complete account, symbol, direction, size and protection before deciding whether to send it.
3 chapters · 9 steps Open guideUse the indicator library and Studio to inspect settings, keep a private variation and apply it to an exact chart destination.
2 chapters · 6 steps Open guideChoose an instrument universe, filter a wide table and inspect its actual source values. Save a useful screen without turning it into an automated trading instruction.
2 chapters · 6 steps Open guideMove from explicit ingredients to readable rules, a historical backtest and a recorded result. Keep hypothetical results separate from trading history.
2 chapters · 6 steps Open guideUse the four Logbook views to read session events, closed trades, original screen observations and recorded results with their own scope.
2 chapters · 6 steps Open guideOpen the private per-trade review to separate what you requested, what the app observed and the available fill evidence. Practice reports identify their simulated execution policy.
2 chapters · 8 steps Open guideReview the work actually saved on your computer, with its original account and source identity. Offline review is a separate local reading workspace.
2 chapters · 6 steps Open guideUnderstand the workstation’s boundaries before executing an order or enabling protection. Checking an uncertain result is different from dispatching another request.
2 chapters · 6 steps Open guide02 / Use the workstation
Give each chart a clear job, then save the arrangement you want to return to. Layout, instrument and drawing choices stay distinct from orders.
A closer look
Select a numbered note to understand the pictured control, or enlarge the capture to inspect its details.
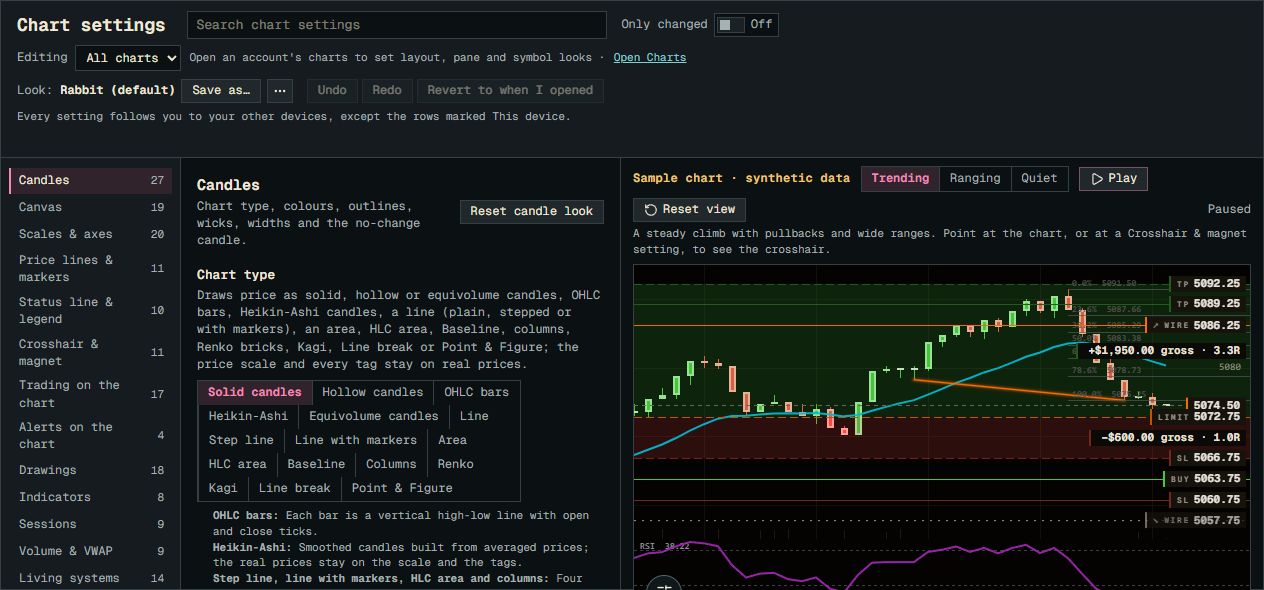
Editing shows the scope. All charts sets the base look; an open account also provides layout, pane and symbol scopes. Check that scope before changing a setting.
Current Chart settings with a paused synthetic sample. The example order overlays and all displayed amounts are illustrative.
Product screenshot with sample data. Pictured controls are not live.
Select a numbered marker. Arrow keys move through notes.
Work with the pane whose instrument and timeframe you intend to inspect. A multi-pane deck has separate chart contexts; a side-rail selection does not make every chart the same instrument.
Choose the deck layout and resize the dividers to give important panes enough space. Focused and multi-pane arrangements are different presentations of your chart work.
Use the chart’s pan and zoom control puck or the mouse. Check the visible timeframe and available history before comparing two views.
Every visible pane has an intentional instrument, timeframe and useful reading area.
Use the layout save control to open the inline Save layout name editor. Enter a name that describes the arrangement rather than the trade you hope to make.
Use SAVE or Enter to commit the name; Escape cancels the name editor. Read any replace or conflict feedback before assuming the saved edition changed.
Choose the saved arrangement when you need it again. Inspect its instruments and pane contexts after applying it; saving a layout is not an instruction to trade.
The saved layout is identifiable and the visible panes still match your intended account context.
The chart-settings gear beside Preferences opens the chart look editor. Website Preferences and the Windows app’s chart settings are different controls.
Editing selects All charts, or an available layout, pane or symbol scope. All charts is the base; layout and pane settings can override it, and symbol settings take precedence. Read the scope and override labels before changing a value.
Search chart settings or choose a section, then inspect the synthetic sample. Appearance edits apply immediately to their selected scope. Use Undo to reverse a change, or Revert to when I opened to return to the visit’s starting look. Save as… keeps a named look.
A chart look cannot authorize trading or change an order’s reviewed levels. Return to the Entry Pad to inspect a staged order rather than inferring its settings from chart styling.
The look has the scope you intended, and the order draft still requires its own review.
03 / Keep the definition handy
10 of 10 public references. The capability descriptions remain separate from the step-by-step guides.
One, four or eight chart panes side by side, each with its own drawing tools and a pan and zoom control puck.
The chart deck is the centre of the workstation. Use one large chart, or split the deck into four or eight panes when you want several instruments or timeframes in view at once.
Every pane has its own column of drawing tools, so choosing a tool on one chart never changes another. Drawings are saved with the account and instrument, and come back when you return to that chart.
Read the Charts guideStage an order by dragging entry, stop and target lines on the chart, size it, and inspect the draft before deciding to send.
The Entry Pad turns the chart into the order ticket. Place the entry, the stop and one or more targets as lines, adjust them by dragging, and the pad shows the size and the amounts at risk as you go.
Staging never sends anything: an order leaves the workstation when you send it. Staged drafts stay in place while you look at other charts, so you can come back to them.
Protection you switch on is reviewed first. After that, the app itself moves a trailing stop or a stop-to-entry, and closes part of the position at each earlier target. It does this only while it is open, signed in and connected. When the app is closed, only the stop-loss and take-profit held by your broker remain.
Read the Entry Pad guideA per-trade report separating your request, verified fills, slippage where evidence allows, recorded costs and missing observations.
An execution review answers a simple question about one trade: what did I ask for, and what actually happened? The report keeps the original request, the application's observations, and the available fill evidence in separate sections. Practice reports identify their simulated execution policy.
For a market order with one attributable attempt and a retained quote from the same feed, the report compares the volume-weighted fill with the dispatch ask for a buy or bid for a sell. Positive slippage is adverse; negative is favorable. Pending-order placement quotes are not treated as fill-time benchmarks, and missing or ambiguous quote evidence stays unavailable.
Costs appear only where they were recorded, and anything that was never observed is listed as missing evidence. Reviews are private to your account and can be reopened from your saved work.
Read the Execution review guideA library of indicators and a Studio for tuning their settings, saving variations and comparing them.
The Indicators page keeps your studies in one library. Open any of them in the Studio to adjust its inputs and how it is drawn, undo and redo changes, and see before and after.
Applied studies are pinned to an exact version and settings, so editing a study later does not quietly change the charts that already use it.
Read the Indicators guideThe Day, The Log, Calendar & Results and journal notes keep a record of what you did and how it turned out.
The Logbook is the record of your trading. The Day lists what happened in the session, The Log keeps closed trades with your notes, and Calendar & Results shows your recorded results by day, as graphs, and compared between periods.
Results are calculated from the trades that were actually recorded, and the basis of each calculation is stated. Where history is missing, the Logbook says so instead of filling the gap.
Read the Logbook guideSaved layouts, charts, drawings, journal and recordings reopen without a connection, and backups are verified before they restore.
Your saved workspace is kept on your computer, separated by account owner. When you are offline you can still open it to review charts, drawings, notes and recorded sessions.
Backups are versioned, and a restore is verified before it replaces what you have. Offline review is for looking back; placing trades always needs the live, signed-in connection.
Read the Offline review guideThe workstation never blindly resends an order whose outcome is unknown, and orders are sent only by you or by protection rules you reviewed and switched on.
Connections drop and applications restart. When the workstation cannot tell whether an order reached your broker, it keeps the original request and checks what happened instead of sending the order again.
Apart from orders you send yourself, the only orders the app sends come from protection you reviewed and switched on: trailing stops, stop-to-entry and partial targets. Those run only while the app is open, signed in and connected, and pause when you sign out, change account or lose the connection. When the app is closed, only the stop-loss and take-profit held by your broker remain.
Throughout the app, values that come straight from your broker or data source, values the app calculated, and values that are simply not available are shown differently, so you always know which is which.
Read the Order safety guideA full-width table of instruments that you filter by value, sort, and save as screens.
The Screener lays your instruments out in one wide table. Choose a market or a list, set value filters, pick a column preset, and sort to find what you want to look at next.
It filters by the values you set. It does not produce trade recommendations, and running a screen never places an order.
Read the Screener guideChoose ingredients, review the rules, run a deterministic backtest, and replay it bar by bar.
Strategies takes you from ingredients to a tested set of rules: choose what the strategy looks at, review the rules it produces, run a backtest with assumptions you can edit, then step through the result on the chart.
A saved strategy can mark its rule matches on a chart or run as a paper simulation. Neither of those sends real orders.
Read the Strategies guideBuild named lists of instruments, browse the instrument library, and inspect the instrument you select.
Tickers is where you organise what you watch. Build named lists in the List Builder, browse the full instrument library, and select any instrument to see it in the inspector.
The inspector's Analyze view summarises the instrument, and its Risk view reads your account to show what a position there would mean, with anything it cannot calculate clearly marked as unavailable. Browsing and editing lists never stages or sends an order.
Read the Tickers guide04 / Account and help
Sign-in, access, billing and account tools. These answers stay available independently of the workstation filters.
Use normal Sign in with your NukBord email. Completing an emailed code or sign-in link takes you to Account. The same email is used for the website and Windows app. Signing out here ends this browser’s session; it does not sign out your Windows app.
Open your accountSubscription shows recorded access and subscription billing separately. A billing problem can need review even when access is recorded. Refresh account requests a new read; it does not make a payment or force an update. After a change in Manage billing, the membership record follows the received billing update, so it may not change immediately.
Review SubscriptionUnavailable means a field could not be established, not that its value is zero. Invoice search, filters and CSV cover matching loaded records. Currency totals include only matching loaded paid invoices and stay separate. You can explicitly read more history when available. These counts and totals are not a lifetime payment balance; missing amounts and source dates stay marked as missing.
Open Billing & invoicesRead your saved display name before saving an edit. This profile name is shared by the website and Windows app; it does not change your sign-in email or billing details. If the saved name changes elsewhere, or a save is unconfirmed, reread it and choose whether to keep your edit or use the saved name. Typing alone saves nothing.
Open Account & securityThe Download page checks whether a member release is published and whether your account currently has access. A published release alone does not confirm your eligibility. Open Download for the current result, including an unavailable release or account read; the account preview is not download authorization.
Check Download availabilityIn your account’s Support section, choose Save on this device to keep a browser copy for this account. Saved copies are reviewed and restored explicitly; changes are not saved automatically. Changing account sections keeps the draft open, but leaving, reloading or unavailable account verification can clear unsaved changes. If storage cannot save, copy or download your draft instead. Review an older saved copy before replacing it.
Review your Support draftNo. Prepare report creates a preview from your entered fields. Copying or downloading also sends nothing to Support. You decide when and how to share the report. If an email contact is available, the email link opens a draft with a subject; it does not send the report. Leave passwords, sign-in codes and card details out of it.
Open the report composerAccount & security includes theme, sound and motion controls for this browser’s website preferences. They do not change Windows app settings or sync those preferences with your account. The full Preferences page offers the rest of the website controls.
Open website PreferencesAdministrators use the same normal sign-in and land on Account. The Admin shortcut in the bottom-right strip is available only when the administrator role is verified. Opening the admin console still checks that role; an ordinary account or a local design preview does not gain administrator access.
Open Account & securityMembership
Read membership details and the actual available purchase terms.
Open Membership →Account
View your membership, invoices and account details after normal sign-in.
Open your desk →Support
Prepare a report in your own words and find the available contact.
Open Support →