One, four or eight chart panes side by side, each with its own drawing tools and a pan and zoom control puck.
Tested on practice accounts and recorded data. The local MetaTrader 5 connection is not yet qualified for customer use.
See the interaction
Explore Charts.
Every demo on this page runs in your browser on simulated data. Nothing in them is sent anywhere.
Share this demo
A public link to this simulated example. Your demo edits, search and account details are not included.
The behavior, explained
How it works.
The chart deck is the centre of the workstation. Use one large chart, or split the deck into four or eight panes when you want several instruments or timeframes in view at once.
Every pane has its own column of drawing tools, so choosing a tool on one chart never changes another. Drawings are saved with the account and instrument, and come back when you return to that chart.
See the workstation
Screenshots & clips.
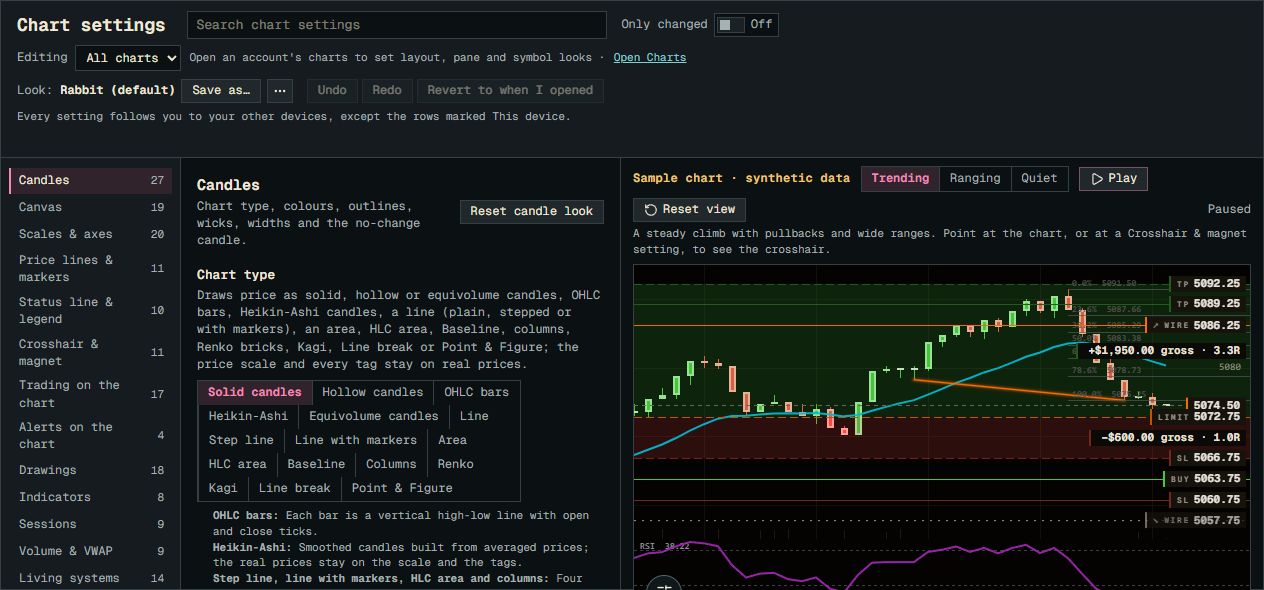
Editing shows the scope. All charts sets the base look; an open account also provides layout, pane and symbol scopes. Check that scope before changing a setting.
Current Chart settings with a paused synthetic sample. The example order overlays and all displayed amounts are illustrative.
Product screenshot with sample data. Pictured controls are not live.
Select a numbered marker. Arrow keys move through notes.
Example data in screenshots and clips is simulated.